 |
||
| Web versions run with IE, Firefox, Opera, Chrome and Safari | Distribution Maps | Desktop versions run on USB Flash Drives with Windows 7, Vista and XP |
|
|
||
|
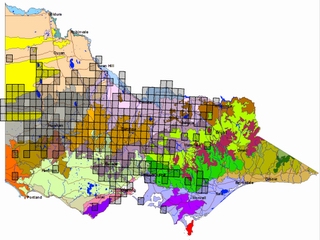
Map
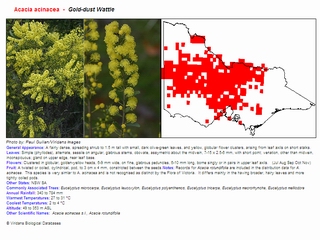
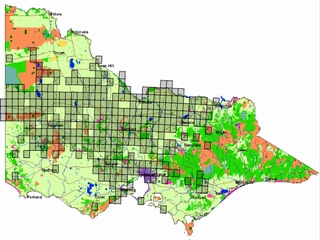
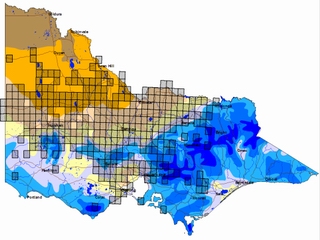
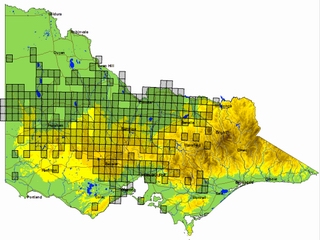
Themes To plot one of these maps you simply enter the name of the plant or animal and click the plot button. The default map will always be the Data Categories but any of the others can be selected from the menu. All the distribution maps below are of Acacia acinacea - Gold-dust Wattle. |
||